Integrating Hystrix Circuit Breakers For Reliability and Performance and Why Timeouts Alone Just Don’t Cut It
In The Beginning . . .
REI.com  first started in 1996 and like many websites has gone through it’s share of growing pains. Shortly after I first started working with the web team
in 2005, we implemented better monitoring tools and for the first time we actually started seeing an overview of site performance
and reliability, or lack thereof as the case was. The website was often slow, had too much down time, and was just
overall less reliable than it should have been. Unraveling all the issues and making the needed improvements to make it fast and reliable would take years;
in fact, it’s a never ending task that continues today. In this post, though, I’d like to discuss one particular issue we had and explain what we did
to improve it.
first started in 1996 and like many websites has gone through it’s share of growing pains. Shortly after I first started working with the web team
in 2005, we implemented better monitoring tools and for the first time we actually started seeing an overview of site performance
and reliability, or lack thereof as the case was. The website was often slow, had too much down time, and was just
overall less reliable than it should have been. Unraveling all the issues and making the needed improvements to make it fast and reliable would take years;
in fact, it’s a never ending task that continues today. In this post, though, I’d like to discuss one particular issue we had and explain what we did
to improve it.
The issue is the reliance of our application(s) on other backend applications or services and what this mean for fault tolerance and performance. Often times backend services can be slow and problematic. Trust me when I tell you, “their problems” are also your problems. We rarely can sever the dependency we have on these other apps. Actually, in today’s world of microservices and distributed systems we often have more of these dependencies than ever.
In fact, all dependencies can be problematic at some point. The more dependencies you have, the more likely you are to have an issue at some point no matter how reliable each one normally is on its own. These could be on premise services or even third party services which are completely out of your control. If you don’t have a way to decouple yourself from these services, sooner or later they will impact your application or site.
Problematic Dependencies
Let’s take a look back at one particular problematic dependency we had on our website back then. There was a dependency on a particular service that, for the sake of this discussion, we will call the ICBS (I Can Be Slow) service. We relied on the ICBS service for checkout; the last place you’d want slowness or breakdowns. The calls to this backend service were important but not absolutely required for checkout to be successful. The ICBS service was totally out of our team’s control, it was in a different division of the company, and the parts of the service we were using were very small parts of a very large and complex app. Long story short, we couldn’t just shout over the wall and yell, “hey fix your app”.
Without the data from the webservice, our customers would have a diminished experience but we they would still be able to checkout. We had to call the ICBS app for a number of different types of transactions. For the sake of this article I am going to concentrate on one particular call that had to be made twice.
| Average Response Time | 99th Percentile |
|---|---|
| 400 ms | 4900 ms |
The average response time (400 ms) was not that great to start with but remember, this is the real world. We’ve all been there. But the 99th percentile was almost 5 seconds!! We had timeouts in place but because 1% of the calls to this service took almost 5 seconds we needed a timeout of at least 5 seconds. In actuality, we probably needed a timeout a bit higher. The above response times are a perfect example of why you want to look at more than just averages or medians when looking at response times but that’s a topic for another article.
So what is the problem here?
Let’s do some more math. Continuing to oversimplify everything in order to stay focused on this one particular issue, we needed to be able to do 10 orders every second. If each order needs to make 2 calls in serial to this backend system, we needed to be able to make 1000 calls every minute to the ICBS service. Also for the sake of simplicity, let’s say we just had one app server for our website. That one app server could handle 50 simultaneous checkout requests from customers.
- time the app itself takes as part of this call is: 200 ms
- ICBS service response time (average): 400ms
- total call time = 200 ms + 400ms * 2 (because we make two serial calls to the ICBS service)
- Number of requests each thread can serve per second = 1000 / (200ms + (400 ms * 2)) = 1
When the ICBS service is up and running: we can respond to 50 (number of max simultaneous requests at one time) x 1 (the number of requests each thread can do per second) = 50. This is way above our requirements of being able to do 10 orders/second. We are good to go.
Now what happens when the ICBS service goes completely offline?
No. of requests each thread can serve per second = 1000 / (200ms + (4900 * 2) = 0.1
50 (threads) * 0.1 = 5   oops!
We can now only keep up with half of our requirement of 10 orders per second. Up to 50 threads could be trying to make orders every second and we can only respond to 5. That means every second, 5 more requests queue. Now we are in a situation where our queue of requests will continuously grow and eventually end users will either give up or more likely the app will start returning timeouts because there is probably have an overall thread timeout configured. If there isn’t a timeout, you’ll just eventually run out of resources. Either way you look at it, things are bad. To make things worse, if the application crashes, the ICBS app could even come back online or return to normal but now our application is down.
The Solution
This is where circuit breakers come into play. We chose to use the open source project Hystrix published by Netflix:
Hystrix Wiki
Their documentation is fantastic. I don’t want to get too into the details of implementing Hystrix because, like I said, the docs are great. Instead, I’ll concentrate on the basics of how we use it and what we have learned along the way.
What does the math look like with the circuit breaker in place?
No. of requests each thread can serve per second = 1000 / (200 ms) = 5
5 per sec * 50 threads = 250 requests returned / sec.
Now we can respond to 250 requests per second where our requirement is only 5/sec. Our app just got faster and has the ability to do more throughput. We aren’t returning the data from the ICBS service, which is bad, but there is nothing we can do about that right now. We did, however, take a bad situation and made the best of it. Our app now continues to run fine. That’s what I call a win! Later, when the ICBS app comes back online, our app is still healthy and will almost immediately start making calls to the ICBS service again.
In practice, it won’t be quite this good because a few threads here and there will still have to make the call to ICBS app to check to see if it’s back up. This is all configurable in Hystrix and you can be as aggressive or conservative as you would like, depending on how important the backend service is.
Keep in mind this is not the only scenario where circuit breakers are beneficial. You may not have a backend call with such a crazy deviation in response time as this example, but if you have a super high throughput call that is normally extremely fast, waiting even a few hundred milliseconds longer than normal, can overwhelm your available resources.
We implemented circuit breakers in stages.
First, we manually started integrating the circuit into the code to get a feel for how they would work in the real world. Services which used to call clients directly, would call the circuit breaker instead which in turn calls the client. Hystrix provides a fallback method, as well. If the normal call fails and the circuit opens, it will invoke the backup method instead. Sometimes this is useful, sometimes it’s not, but it’s nice to have the option.
Later we started using Hystrix Javanica which provides annotations and makes using Hystrix even simpler.
If you use Spring, it actually has first class support for Hystrix now, as well. Spring integration docs
Monitoring Hystrix
Hystrix has a servlet (HystrixMetricsStreamServlet) you can configure which will provide a stream of data about all the circuits. You can then configure a Hystrix Dashboard and point it to the stream of data. This will show a nice overview of all your circuits in real time (and thread pool metrics for them if you are using thread pools).
In order to aggregate the data from multiple streams (app instances) into a single dashboard, you will need Turbine. Turbine aggregates the data from multiple streams into a single stream which is then viewed with the dashboard.
Hystrix Learnings . . .
Stats
We like to measure and record as much as possible at REI. Even though we implemented Turbine and the Hystrix Dashboard, the dashboard only provides a snapshot in time and doesn’t provide alerting or integrate into our normal dashboards. To get around this you can use the Hystrix Event Notifier plugin. This gives you a place to plug into the the Hystrix code and collect metrics per call (or whatever else you need to do).
It looks something like this:
HystrixPlugins.getInstance().registerEventNotifier(new HystrixStatsNotifier());
Inside HystrixStatsNotifier we collect metrics such as responses time count and forward these to our Graphite backend.
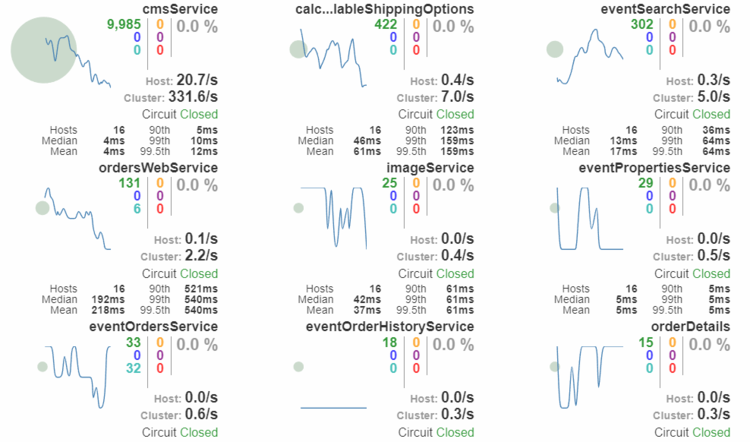
This lets us put metrics in Graphite for each circuit breaker we have.
Here is an example of metrics for one particular service:
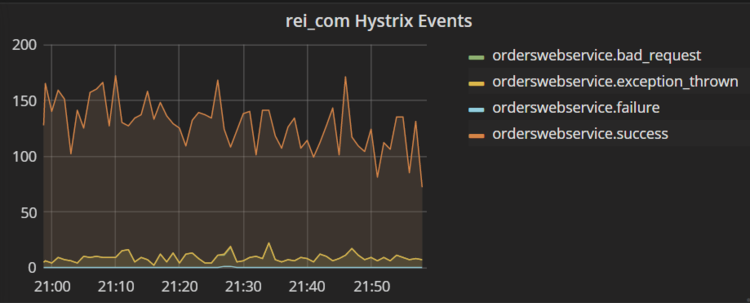
With the data in Graphite, our normal stats repository, we are free to integrate Hystrix data with other dashboards, view it historically, and alert on it.
Hystrix Metrics Streaming Concerns
If you enable HystrixMetricsStreamServlet in order to use the Hystrix Dashboard or Turbine, there is no security around it. You will most likely want to block this from outside access since it’s something you probably don’t want in the wild.
We also found certain APM monitoring tools can get confused by the streaming nature of the Hystrix Metrics servlet. They will end up counting the response time of the call to the streaming servlet as some huge response time number which will throw your overall averages way off. If this happens, you will need to exclude this class/url from your APM metrics collecting.
Turbine Configuration
Turbine is configured by default by a config file where the apps you want to monitor are listed along with the servers in each app and the corresponding port number. Turbine uses Archaius for its configuration management. Archaius allows you to pull the config file in from a url, as well. If all your services are on hosts/ports that don’t change, you can manually set them in the config file but if your services are deployed dynamically in containers like we do, your hosts/ports will change all the time. In this case you can regenerate the config file continually or point to a url somewhere that provides the config. It would look something like this to point Turbine to a url that returns your config
export JAVA_OPTS="-Darchaius.configurationSource.additionalUrls=https://{domain}/rs/utils/turbine"
Turbine will keep reading the file and update itself with new hosts/ports. We have found that only hosts/ports are updated. The actual list of apps is only read in once at startup.
Turbine also supports instance discovery, if you would rather go that route.
Conclusion
In summary, when you have a response time with a high standard deviation, you are inevitably required to have a longer timeout than you would like for your backend service. When that service then fails or gets slower than normal, you are likely to run out of resources for your application due to the wait time on the problematic backend service. Even if you don’t run out of resources, you are making your customers wait for no reason.
Each additional dependency you have adds additional chances of interruptions or outages. Each service you rely on adds a potential for 4 to 5 minutes of downtime each month even though each service individually has 99.99% up time. If you rely on 20 dependencies each with a 99.99% sla, that’s up to 100 minutes of down time a month. Ouch! That is not even worst case scenario since your app can easily become unstable itself when not decoupled from problematic backend services.
Remember, failure is inevitable. Plan for it!