Catching the Wheel
Days before the holiday sales change freeze, the web performance and analytics teams deployed a change that drastically improved front-end performance. A new configuration on a third-party script led to a 60% improvement to First Contentful Paint (FCP). This rocketed us to the top of our industry performance leader board. Most importantly, our real user data met Google’s Core Web Vitals goals: A strong indication of a great customer experience.
This change took months of deliberation. We collaborated across teams and with our A/B testing vendor. This journey entails good times, bad times and some humbling realizations. You won’t find a clearly defined list of tips for overcoming third-party vendor performance woes. This is a story with events I hope help guide you in tackling large, seemingly insurmountable problems like we faced.
If a Tree Falls in the Forest…
In the field, REI leverages Google’s Core Web Vitals (CWV). These quality signals uncover real users’ experience on rei.com with metrics like FCP and Largest Contentful Paint (LCP). These metrics signify critical points in a web page’s loading process. Without CWV, loading issues fly under the radar. After all, software engineers typically use powerful laptops on stable connections.
Our CWV scores hovered between “needs improvement” and poor. We had to get to the bottom of it.
The State of Web Perf in the Industry
To identify issues, the web performance team runs lab tests with emulated affordable devices on slower connections. Everyone should do this. Making a website fast on an affordable device makes it fast for everyone. Throttled lab tests make issues more pronounced and easier to prioritize, too–win-win.

The homepage on a mobile device with 3G doesn’t look great. That’s a pretty slow configuration, though. Almost every site should run that slow, right? Let’s take a look at some other sites.
Ouch! REI’s search page sits dead last compared to other search pages. If you’re an REI engineer reading this, you’re probably shocked. We build our pages with Server Side Rendering (SSR) and efficiently cache them at the edge. Content should render the instant a browser receives HTML. If we’re doing all of this work, something external must be at fault.
In bicycle racing, it’s key for cyclists to “catch the wheel” of their competitors. Sitting in your competitors’ draft removes a great deal of wind resistance and allows you to pedal softer. While in the draft you can recover to prepare yourself for the sprint to the finish. The web performance team called this effort “catch the wheel” to drive the point home. If we remove this performance roadblock, we’ll be in the front of the pack and ready to sprint for first place.
Identifying the Problem
If your FCP and LCP warning lights go off, it’s time to evaluate your critical rendering path. Something’s probably gumming it up. When we first investigated the issue, we had 4 render blocking assets:
- A small security related script
- CSS for a global component (a problem for later)
- A tag manager
- A client-side A/B testing script
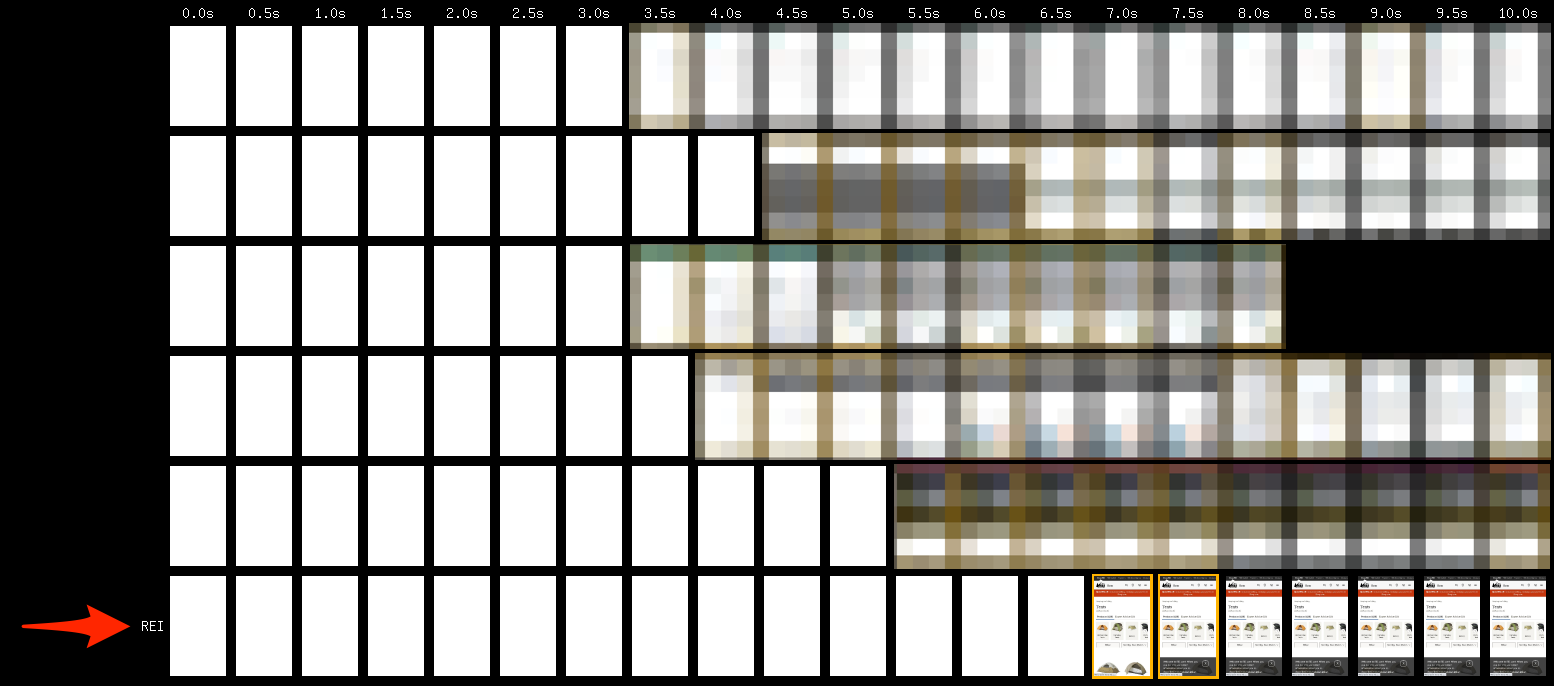
One of these must make a huge impact. The quick and dirty solution is to run tests with each critical asset blocked, one by one. Compare the tests and see which asset makes the biggest impact. When we got to our A/B testing script, things cleared up.

An FCP change from 8 second to 3.5 seconds is a massive improvement. Why does it make such a huge impact?
An aside on “anti-flicker”
Client-side A/B solutions attempt to resolve an issue called “flicker” in two ways:
- Make their script render-blocking
- Run an “anti-flicker” snippet that hides the page with opacity: 0 until targeted content arrives
“Flicker” denotes an experience where the user sees default content that swaps with targeted content. To be fair, that’s a pretty jarring experience. Flicker makes pages inaccessible, too. A unexpected content swap messes with cognitive load and pulls the rug out from under screen readers.
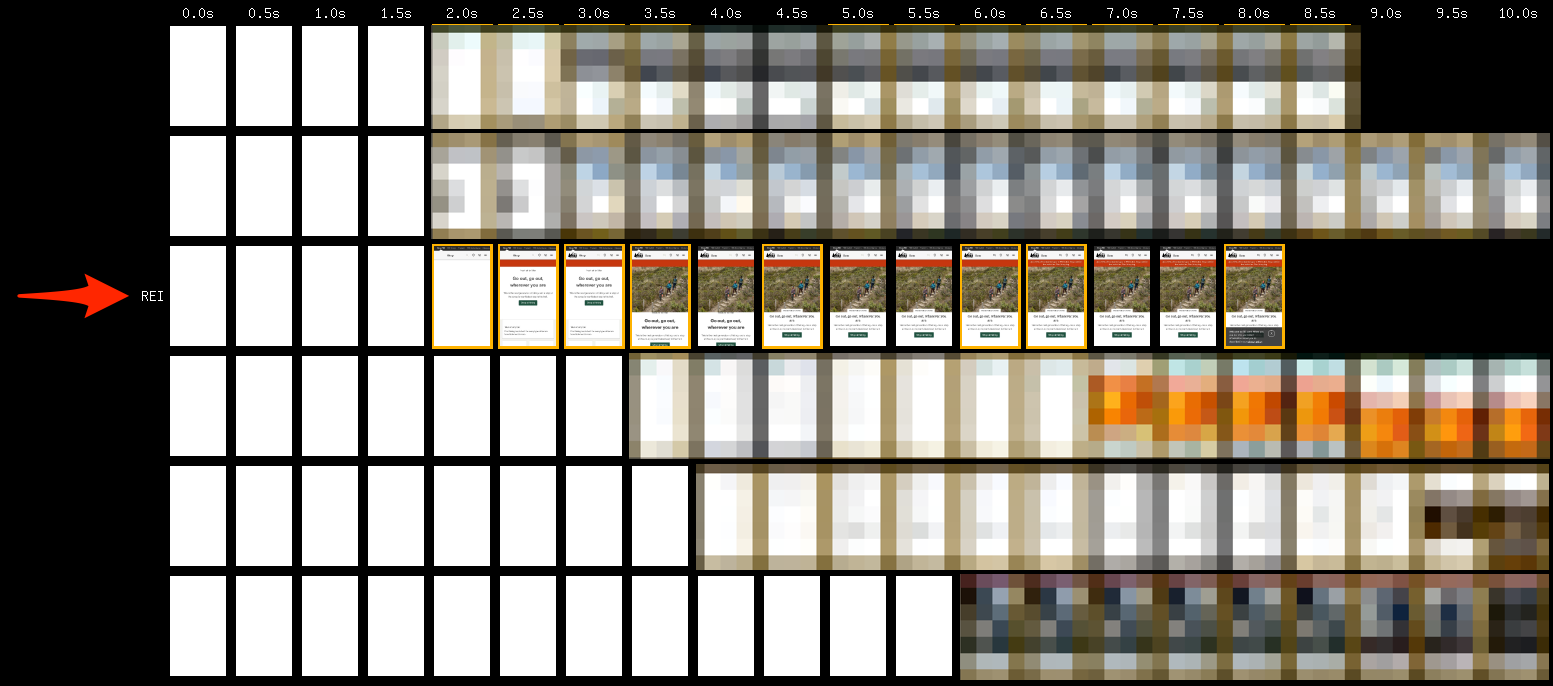
Here’s an extreme example where flicker happens above-the-fold on a hero element:
On the flip side, anti-flicker destroys page speed. Our lab tests indicate a 4.5 second increase to FCP on mobile devices. We’re trading bad UX for bad UX. If we have a bad testing experience and bad performance, where can we make a comprise? Here comes the humbling realization part.
Unblock the Rendering Path
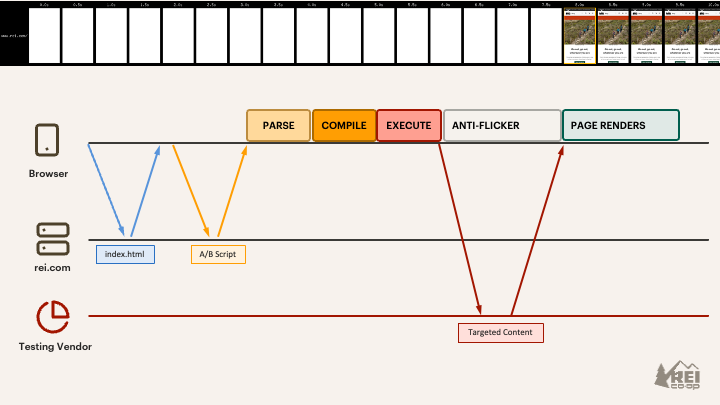
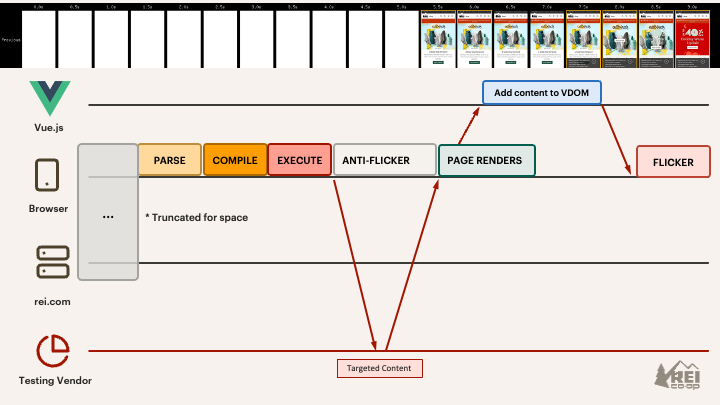
Since I joined REI in March, the performance solution to the A/B problem seemed obvious: make the script non-blocking and allow flicker(disable anti-flicker). A performance consultant suggested something similar. They kept it simple and only recommended turning off anti-flicker. After some testing only disabling anti-flicker unfortunately didn’t change much. This diagram helps explain why:
The real crux of the issue lies in the render blocking nature of the script. Everything screeches to a halt until that script gets dealt with. Let’s see how the page would load if we add “defer” to that script:
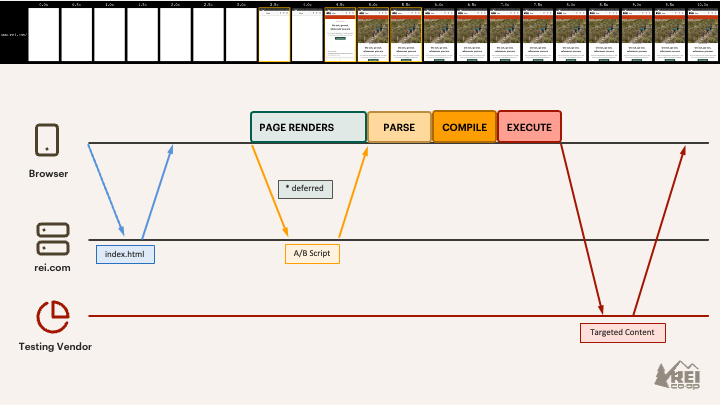
With the script deferred, the page can render as soon as possible. The browser downloads the script in the background and waits to run it after the HTML gets parsed.
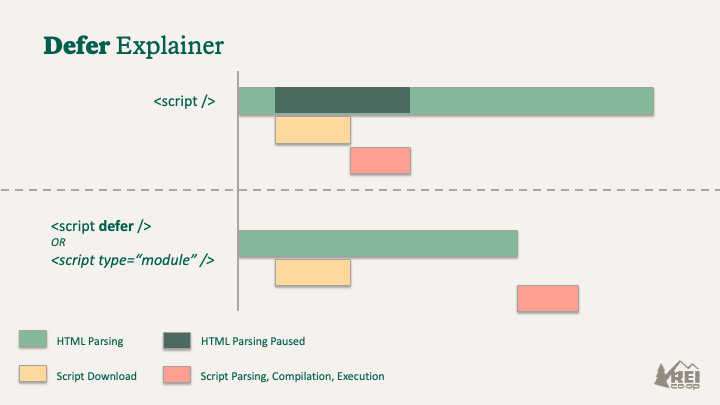
Deferring scripts is a great web performance technique. Use it wisely, though, because it changes the execution order of scripts on the page. The A/B script lives in the <head />. With defer present, the browser will get to it after scripts at the end of the <body /> run. When a script at the end of the <body /> also has defer, the execution order is preserved. The browser will queue them up based on their position in the HTML.
Here’s a high level defer diagram:
This proposal looks great for the web performance team, but what about the analytics team? When we defer the script and disable anti-flicker, we guarantee flicker. This boost to performance degrades the testing experience. REI or any company won’t accept this compromise. Unless…
I Made A Massive Oversight
The problem appeared impossible to solve. Changing vendors to maybe have a faster client-side A/B solution costs too much. Improving performance, but making our UX jarring isn’t a great trade. Our proposal seemed like the only solution, and no one would accept it unless it preserved or improved the testing experience. After some cross team face-to-face brainstorming sessions we realized something huge: flicker already happens in production.
For months I assumed the anti-flicker mechanism worked. In all of my performance tests, I hadn’t witnessed flicker. Our consultant even suggested accepting flicker as if we had that solved the whole time. It turns out a race condition occurs between our A/B script and our front-end framework, Vue. The A/B script un-hides the page once it receives targeted content, but that’s too soon. That content needs to get processed by Vue before rendering. This race condition caused flicker.
Flicker was ingrained in the testing culture at REI. The marketing team knew they should only test elements below-the-fold. They avoid large, above-the-fold tests, like the one in the video. The testing team worked around the problem and I was none the wiser. To be fair, I recall the analytics team mentioning flicker impacted tests, but I assumed it was rare. Never make assumptions! This was a huge learning experience for me.
We met with the vendor a few times to make sure deferring the script wouldn’t break anything. We found out some other companies already defer the script and accept flicker. Unfortunately that wasn’t documented anywhere. Face to face conversations are hard, but again proved themselves to be crucial in this whole process.
Rollout
Now that we confirmed the testing experience won’t change and got vendor approval, it was time to roll out the performance improvement–with one week left until the code freeze. The analytics team leveraged our in-house feature toggle solution to make adding “defer” and disabling anti-flicker a breeze. This configuration based approach gave us a fast fallback if something went wrong. The web performance team reached out to every site owner within rei.com to make sure their site could accept a deferred A/B script. 10 PRs later, we were ready to roll.
Results
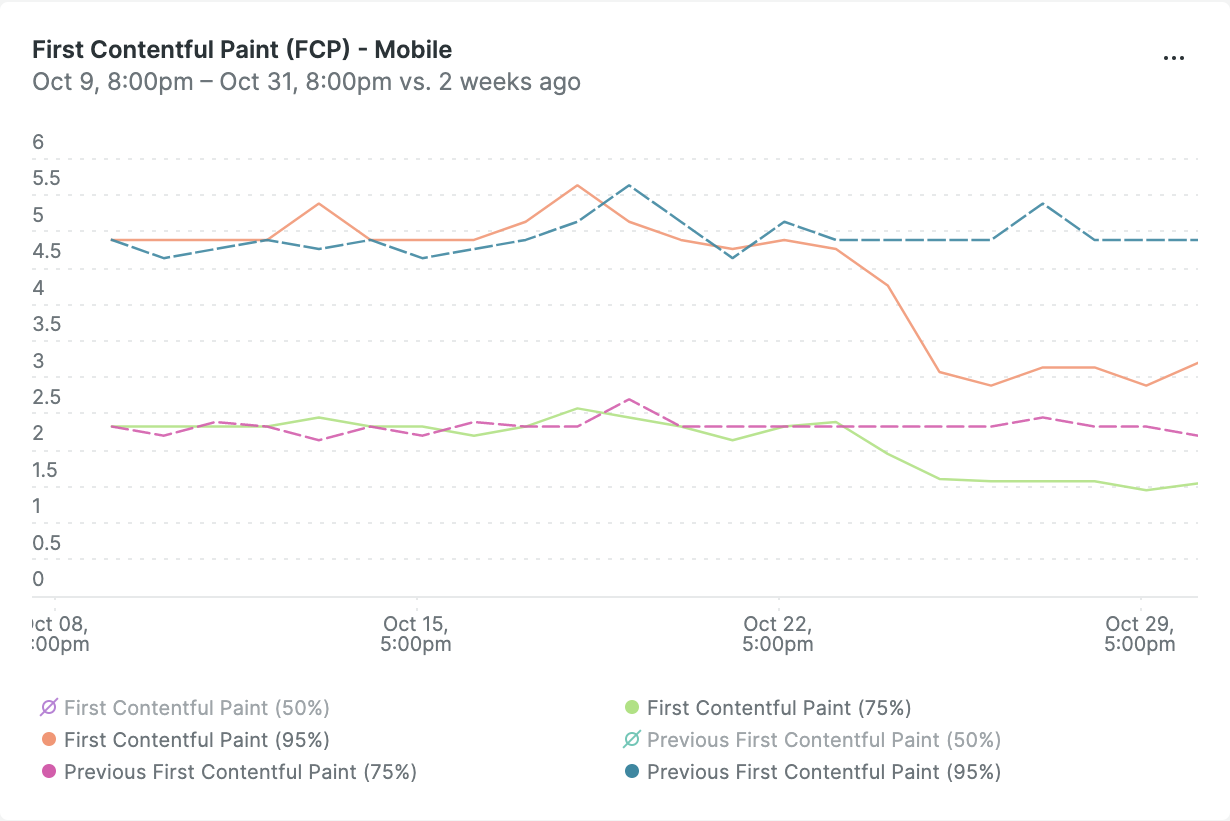
We rolled out the change at the end of October. The results were astounding. I’ve shown a lot of lab test data, so let’s look at the real user impact.
FCP Improvements to the Search Page
LCP Improvements to Product Pages
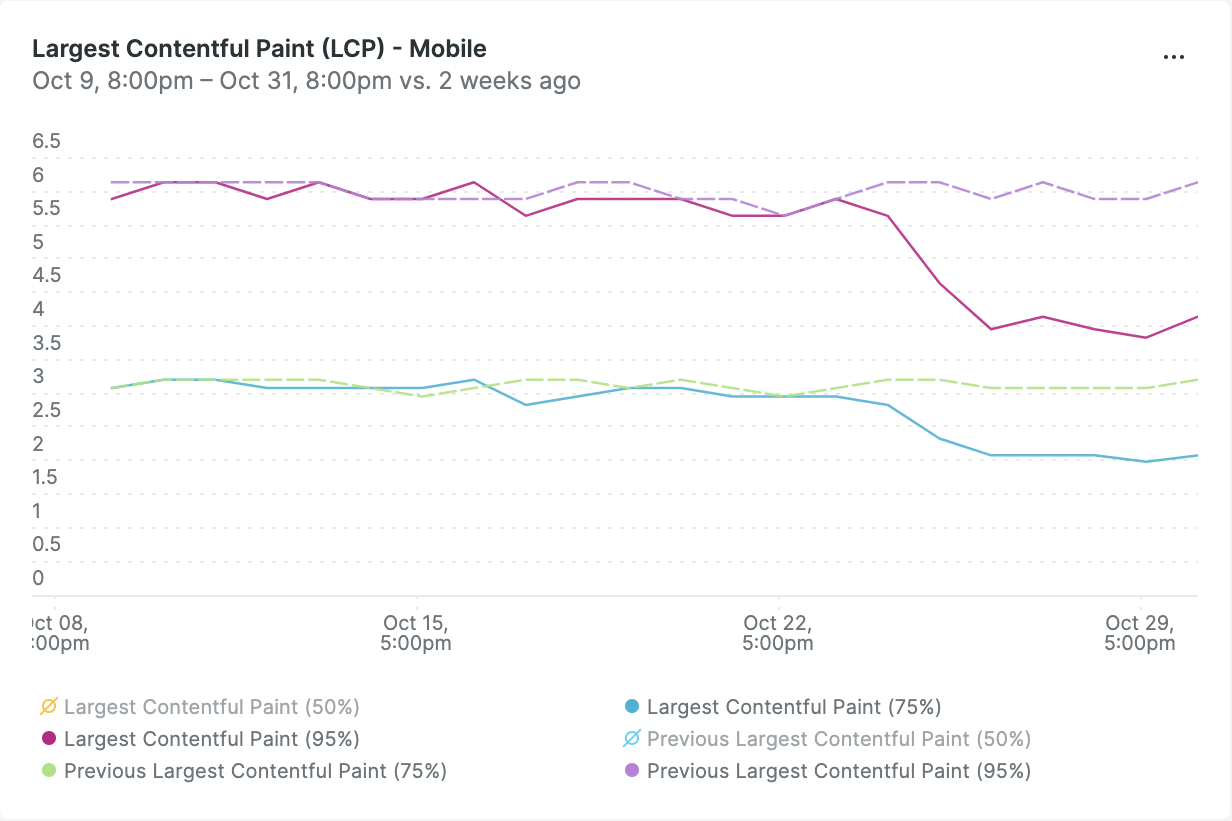
This change brought our average FCP to Google’s recommended zone. A lot of our LCP scores now meet recommendations, too. Although there are some pages that need more work. This performance improvement uncovered a lot of issues hidden by the render-blocking script. Now that the page loads faster, we can eke out better LCP scores and tackle new issues with CLS, TBT and more.
Back to the lab tests, we compiled a list of the improvements to LCP and FCP scores:
FCP
| Page | FCP Before (seconds) | FCP After (seconds) | Delta (seconds) |
|---|---|---|---|
| Homepage | 5.6 | 2.01 | -3.6 |
| Search pages | 7.06 | 1.9 | -5.2 |
| Brand (custom landing) pages | 5.51 | 2.15 | -3.7 |
| PDP | 5.52 | 1.92 | -3.6 |
| Outlet PDP | 5.44 | 1.94 | -3.6 |
| Expert Advice home | 5.4 | 1.7 | -3.7 |
| Expert Advice articles | 5.22 | 2.67 | -2.6 |
| Adventures home | 5.93 | 2.27 | -3.7 |
| Adventures trip pages | 5.28 | 2.25 | -3 |
| Classes & Events home | 6.55 | 1.89 | -4.7 |
| Classes & Events detail pages | 5.83 | 2.1 | -3.7 |
| Retail store pages | 5.1 | 1.95 | -3.2 |
| Newsroom | 5.86 | 2.19 | -3.7 |
LCP
| Page | LCP Before (seconds) | LCP After (seconds) | Delta (seconds) |
|---|---|---|---|
| Homepage | 5.6 | 2.94 | -2.7 |
| Search pages | 6.45 | 3.67 | -2.8 |
| Brand (custom landing) pages | 5.6 | 3.13 | -2.5 |
| PDP | 5.68 | 2.61 | -3.1 |
| Outlet PDP | 5.44 | 2.36 | -3.1 |
| Expert Advice home | 5.4 | 3.9 | -1.5 |
| Expert Advice articles | 5.22 | 3.78 | -1.4 |
| Adventures home | 5.93 | 2.98 | -3 |
| Adventures trip pages | 5.34 | 4.38 | -1 |
| Classes & Events home | 5.71 | 4.47 | -1.2 |
| Classes & Events detail pages | 5.83 | 2.73 | -3.1 |
| Retail store pages | 5.34 | 2.83 | -2.5 |
| Newsroom | 5.86 | 3.02 | -2.8 |
And lastly, let’s see how REI stacks up against other industry websites:
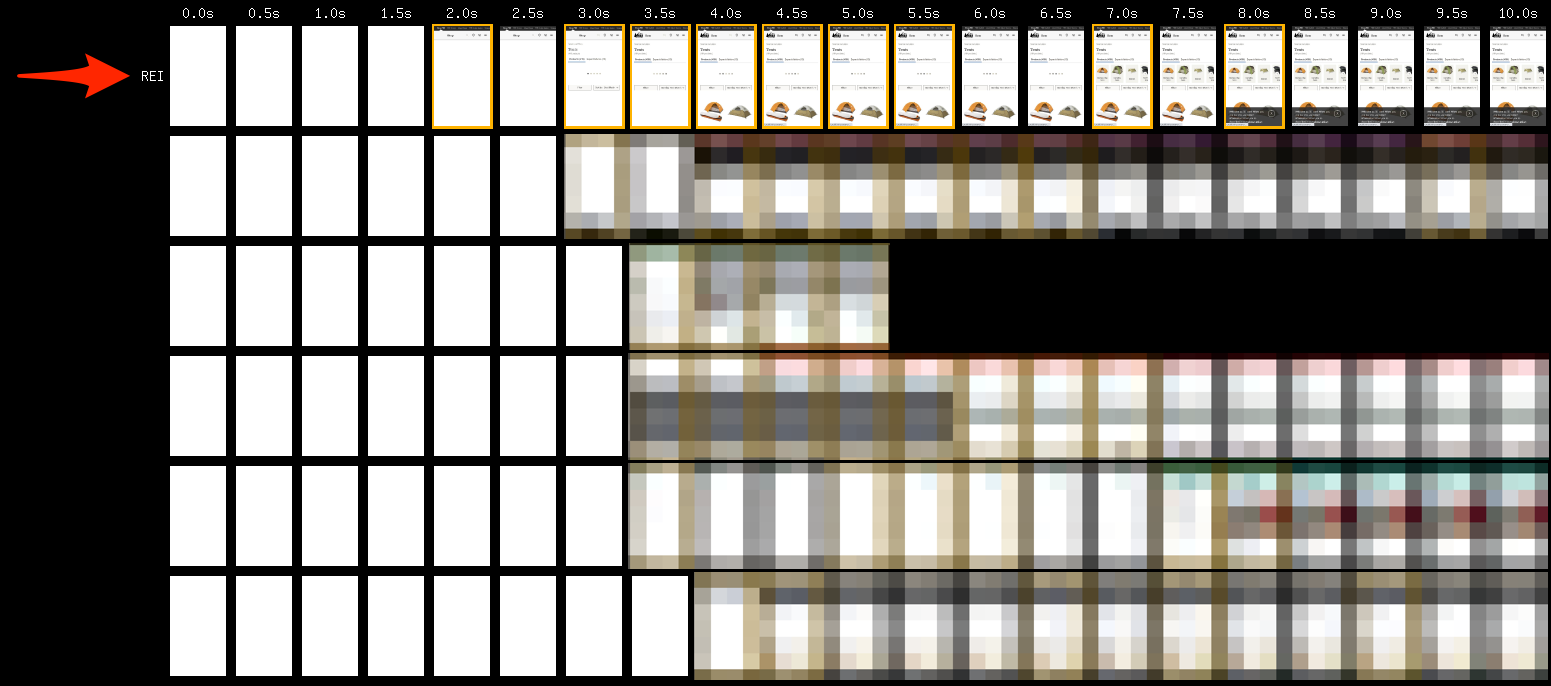
We caught the wheel and now sit at the front of the pack! In some cases we’re in the lead and in others we’re in the perfect position to lay down power and sprint for first place.
The Future of A/B Testing at REI
Wait… Aren’t you forgetting something?
Our solution didn’t solve flicker. We noticed it’s always happened and left it where it is. This experience continues to limit the marketing teams in how they design and perform tests. We can do better!
Our vendor suggested we implement their element hiding solution. We can selectively hide elements until we receive targeted content then render them. We can take it a step further and build a loading treatment for these elements. Our design system already had this in their backlog and just needed the right use case.
This solution will enable tests above the fold and extend marketing’s capabilities. We’ll keep the script deferred, too. The page will continue to render as fast as it does today.
One Last Compromise
An element hiding solution requires a bit of manual work. Developers or testers need to mark an element as the one getting tested so it can have a loading state. This is a classic case of user experience (UX) over developer experience (DX). The modern web has a problem with favoring DX over UX. That’s why JavaScript size has ballooned in recent years. (HTTP Archive Average JS Size Over Time) As web developers, we need to put the user first. The web is a beautiful thing. Let’s not squander it.
Kudos and Shoutouts
This was hardly a solo effort. This massive leap in performance wouldn’t have been possible without everyone involved at the co-op. Erik Luchauer and Marina Robbins handled the meetings, work prioritization and communications. From the analytics team, Brian Mendez and Evan Chang were right there with us through the end. Brian set up the rollout process so it could go as smoothly as it did and Evan kept us focused and advocated for web performance. Kat Valdre brought us front and center to our vendor so we could hash out details and get that critical green light. Every site team at REI promptly brought in our pull requests and chipped in if something got left out along the way. And thank you to the design system team for bringing in the progressive loading work so quickly!
